Hello,
There are a lot of misconceptions with respect to the actual hydro pricing mechanisms in Ontario. I think it is best that I explain how hydro prices are determined. Historically in Ontario, the total demand for hydro has been equally split between households/apartments and industrial/commercial end users. Given that, the price charged to both has historically been the same. This differs from other counties were residential users pay higher hydro rates than other users. Let me start explaining the basic components starting with the Hourly Ontario Energy Price (or HOEP). Keep in mind that the total price of hydro is based on both peak load and volume but it varies widely across different users.
Let me start explaining the basic components starting with the HOEP. Keep in mind that the total price of hydro is based on both peak load and volume but it varies widely across different users.
Hourly Ontario Energy Price (HOEP)
The HOEP is the wholesale price of hydro in Ontario. It is the marginal cost of hydro at any five-minute (5) interval in the Province of Ontario. The market clearing price is set every five (5) minutes with all twelve (12) making the hourly price. The prices charged is the weighted average of those prices. It is referred to as the commodity cost on the hydro bill of both Class “A” and Class “B” end users.
The HOEP can range from below zero to a high hourly price. This is caused by temporary supply/demand factors, current import/export trends and of course the temperature. The point is it is based on volume (or total demand) of actual hydro used. Every end user is charged the HOEP based on total demand.
Global Adjustment
The chart below will highight the components of the Global Adjustment.
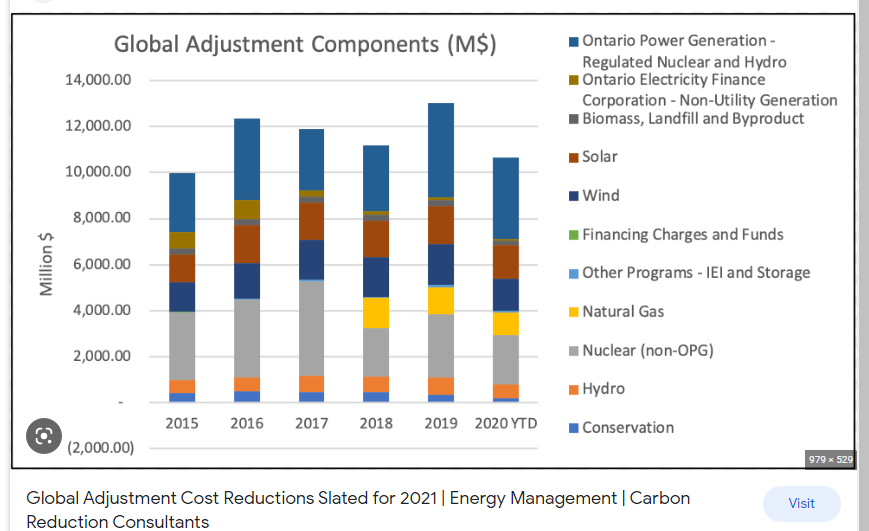
The components of the Global Adjustment (GA) are not relevant to this analysis as this is a brief summary overview. (If you were to project long terms effects then it would, but for now I will keep it simple). The (GA) is paid by residential consumers and small business consumers with less <50kW peak load through tiered charges (in rural Ontario) and through time- of -use (TOU) with smart meters in urban areas. Class “A “ users are charged based upon their peak load factor in what is essentially a capacity allocation model. Class “B” users are charged on a volume or total demand basis. The total costs of the system have to be eventually paid by all users. I won’t get into the deferred accounts for all total hydro users at this stage. The simple fact is that the Province has basically been subsidizing all hydro users during COVID. They can’t afford to do this forever and under NAFTA, I will not be surprised if one of the states/Federal Government (USA) sues Ontario for this direct subsidy.

There is one (1) line in the above passage to note. Once the amount of GA is billed to Class A customers has been settled, the remainder is passed onto Class B customers. (I will revisit this passage and it’s implication later on in the analysis).
Peak Monthly Demand Charges (PMDC)
This is pretty straightforward, as the total (PMDC) are based on the highest usage of that particular entity or company in any 15 minute period during that month. So these would include your distribution volume rate. network and connection service charges. These do vary quite a bit between local distribution companies ($15.0966 for Toronto Hydro), $13.827 for Oshawa and $11.7445 for Pickering). These are all based on a per kW basis .The one standard seems to be that there is a.62 cents per kW rebate for transformer allowance.(I would also point out that Pickering has an appllication to increase these charges at the Ontario Energy Board (OEB). ( There is also a pretty standard 4% line loss allowance which is of course charge to all users based on volume). Thus where you are located can make a big difference on the return on investment for any client. That’s the location and whether or not there’s a pending application at the OEB to increase rates will affect the ROI of your products.
Total Price of Hydro in Ontario
HOEP + GA (Class “A”) + PMDC +HST
HOEP + GA (Class “B”) + PMDC +HST
Plus, a general 4% Line Loss factor based on Volume.
All electricity customers in Ontario pay for Global Adjustment (GA) costs in a separate line item on their hydro bill. The monthly GA rate is set based on GA costs and the real demand and pricing for hydro. Thus, GA costs vary from month to month depending upon underlying trends in the real market, but the overall yearly rate will balance total GA costs between the estimated and actual costs. Because of this and other factors the IESO has admitted that it cannot forecast future monthly GA costs, only total costs with total demand. So, there you have it.
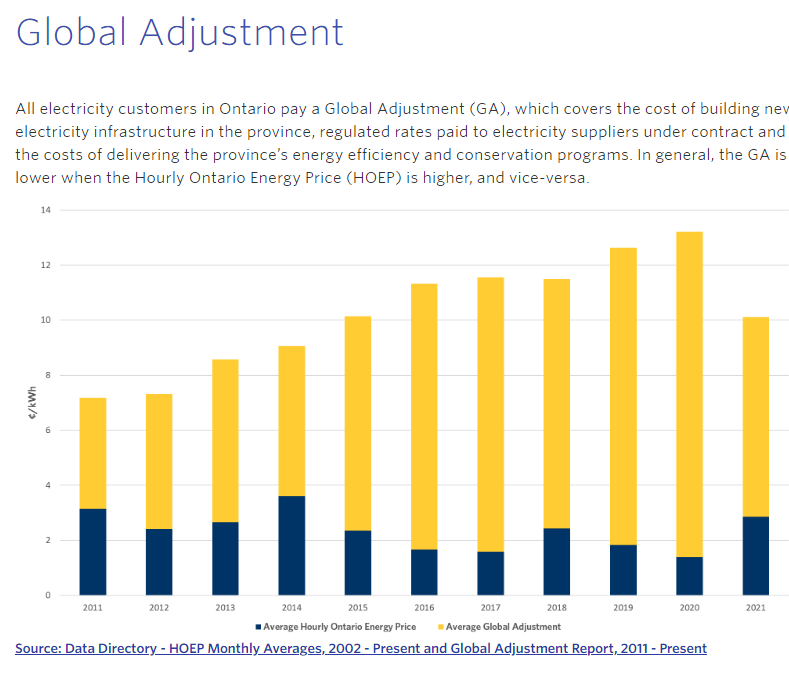
To be clear, the blue in the chart is the HOEP and GA is in yellow.
So, what does this all mean and how can I use this knowledge to sell my products and services? Let me start off with Class “B” customers. I will then explain the peak load factor (PLF) for Class “A” end users and an example for Class “A “. (I am starting off with Class” B” because this will be most of your potential clients).
Class “A” and Peak Demand Load Factor
If your monthly your average monthly demand peak demand is over five megawatts (MW), you have no option- you will as a Class “A” end user. The (GA) for any firm is based on their proportionate share of total overall demand in the five highest peaks demand hours in the previous year. The peak load factor (PLF) would be applied to total GA Class “A” pooled costs. the base. The reporting period is from July 1st to June 30th of the preceding year.
The fact is that some Class “B” end users between 1 to 5 Mw can opt into Class “A”. Moreover, some Class “B” customers (depending on their NAICS Classification) between 500K to 1MW can also opt into Class “A”. Class “B” end users above 50K to 500K must stay as Class “B” end users.
So, for example if you are a Class “A” end user your GA costs in 2023 would be based on your PLF for the previous year and once it is determined you are locked into that peak load factor.
5CP Your Peak Demand Total System Wide Demand (All end users)
1 6 23,000
2 7 22,500
3 8 24,000
4 5 22,000
5 6 25,000
32 MW 116,500 MW
32/116,500= .00027468 (the regulator goes to 17 digits)
So, what does this mean? Well, the end user is going to pay .00027468 % of the total GA Class “A “pooled costs. These pooled costs vary per month but your PLF for that year will not. Let us assume that for this month the total Class” A” pooled costs are 600 million (which is what about their averaging now), then your GA cost for that month would be 600,000,000 X .00027468% or $164,806 for that month irrespective of your actual usage for purposes of the GA.
Remember you’re still paying the OHEP based on what you have actually used and you are still paying your peak monthly demand charges based upon the highest usage in any 15-minute time interval in the entire month. (Thus, in some months your peak monthly demand = to one of the days used to calculate the top five (5) system wide peaks. I will get back to that.
Now, let us say you could reduce your keep demand usage by one (1) MW during the five total peaks which are used to determine that the PLF. You would get 27/116,500 or .00023176 for your PLF and at $600,000,000 x .00023176% your GA for the month would be $139,056 for a savings of $25,750. Your lower PLF would reduce your share of Class “A” pooled costs.
Now determining when the peak loads are going to occur is straightforward. In fact, the regulator sends an e-mail to all users (and even post it on the web site) the day before they expect a peak hour to occur. The simple fact is all the Class “A” users curtail their hydro during these hours. If all reduce their peak demand by the exact same amount the actual PLF will obviously not change. However, 99% of Class “A” energy managers don’t even know when in the hour the system wide readings are taken.
Overall, and getting back to what I pointed out before on page –3-
There is one (1) line in the above passage. Once the amount of GA is billed to Class A customers has been settled, the remainder is passed onto Class B customers.
In essence, whatever the total pooled costs carveouts for Class “A” are the balance is paid by Class “B” end users. In 2022, Class “A” users paid $ 1.096B in GA costs (14.5%) and Class “B” paid $6.2 B (or 85.5%). However, Class “A end users used 40,151 TWH (or 21%) of total demand and Class “B” only used 155,294 TWH (or 79%) of total costs. This is just one year but the fact is that Class “B” users are paying a higher proportionate share of total costs than Class “A”. Class “B “users have been subsidizing Class” A “user for many years. This led to a court case where the National Steel Railway Car Company (based out of Hamilton) sued the Provincial Government basically arguing Class” B” users were subsidizing Class “A” end users. The court agreed that Class” B” users were in fact subsidizing Class “A “users, but that if that was Government policy then it was Government policy. The court would not get into the wisdom of those policies, just the fact that the government had the legal authority to introduce the policies they saw fit. (There was no appeal to the Supreme Court of Canada which I think would have reversed the decision).
Why is this a disparity between Class “A” and Class “ B “and users? The large Class “A” users threatened to leave the Province if hydro costs weren’t brought down. The province wasn’t going to increase hydro rates on voters so the Class “B” users paid for this policy.
So, what are the actual peak hours. Let’s take a look at last year which is/was pretty typical.

Historically, as you can see the systemwide peak hours that are used to determine the PLF (for Class “ A” users) usually always come in July and August which is the beginning of the reporting period (for the upcoming year) between 5 and 7 pm. Again, the system wide operator (the IESO) even tells its customers and the public this in advance. You can go back and check this for how many years you want and you will see that this is the pattern.
Now with respect to the PMDC levied by the local utility this is again pretty easy to figure out. Any potential customer can simply as the LDC to get the excel spreadsheet for their 15-minute demand interval readings for the entire year. For cold storage companies, these peak demands are generally around 5:00 to 7:00 PM throughout the year peaking of course in the summer months. If as you claim the client can pre-set the refrigeration and HVAC to work just before an shut off during these peak monthly demand time period it would save a lot of money. ( I am oversimplifying it here- but it can be done).
So let us put the OHEP, the GA for both classes and PMDC costs together.
Class “A”
For Class “A” the HOEP (or spot commodity charge) would lowered since it is simply based on total demand or volume of hydro used. You could save on GA costs by lowering your PLF which would not be hard to do and could save substantial amounts of money. My estimates (which I have not shown here but can) if done properly the average Class “A “end user would save about $500,000 a year on GA charges based on just a one (1) MW reduction in peak demand during those peak hours which determine the PLF. peak load factor. As far as the PMDC could be curtailed, it might be a bit trickier but it can be done.
Class “B”
For Class “B” which will be the majority of your potential clients- it is much simpler. The total amount is the HOEP and GA rate (in kWh’s) for that month X reduction in total kWh’s due to the use of your product. If the client used 50,000 fewer kWhs then the client would save 50,000 X $.10 or $5000 for that month. The treatment of the PMDC would be the same as Class “A “.
Across all customers you would be saving of course an additional 4% on the line loss allowance and 7% on the HST. There are a series of small administration cost based on total demand which you again would be saving on. One would also save on operating, maintenance, depreciation allowances etc. due to reduced run times of the refrigeration equipment etc.
Historically, 50% of the total demand for hydro was for residential end users and 50% for Industrial end users. At that time all users paid the same proportionate share of total system costs and the same price. (This is in contrast to the USA where residential, commercial and transportation sector end users’ pay more and large Industrial users pay less).